

Extreme heat and human exposure to it is on the rise.
There is robust evidence that climate change is affecting the frequency, intensity, and duration of heatwaves. These trends are projected to continue for the foreseeable future without rapid mitigation of climate change. Tool tip Increasing frequency, intensity and duration of observed global heatwaves and warm spells
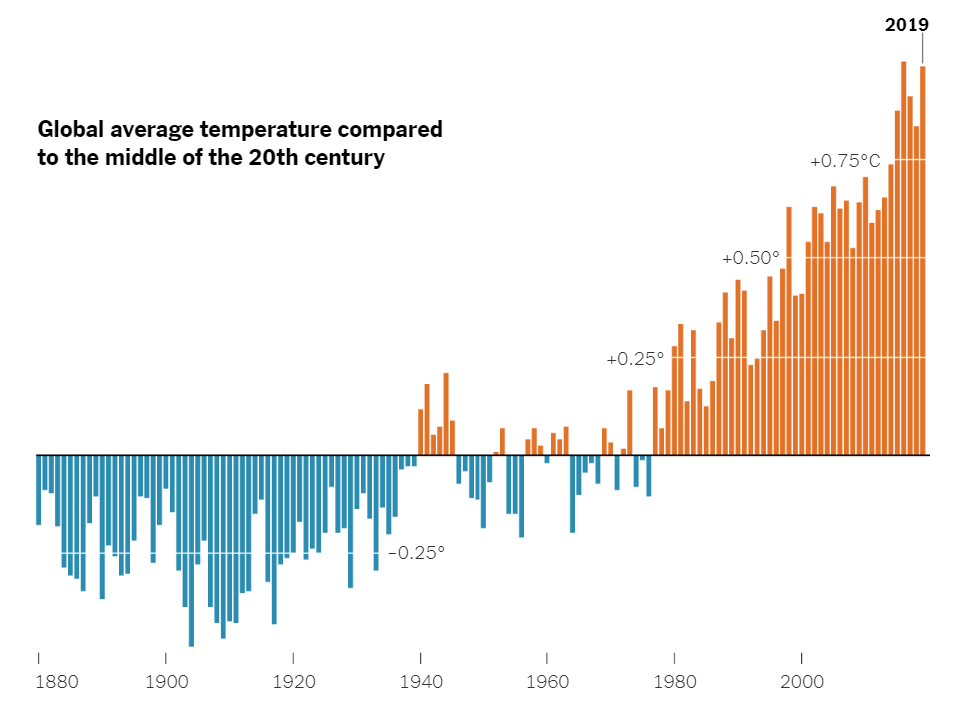
Source: New York Times
Understanding Temperature and Heat
Heat and temperature are related to each other, but are different concepts. Tool tip Khan Academy: Heat and Temperature Heat is thermal energy transferred from a hotter system to a cooler system, while temperature is a measure of the average kinetic energy of the atoms or molecules in the system, expressing hotness and coldness in terms of any of several arbitrary scales like Celsius and Fahrenheit. Tool tip Heat: a primer for public health researchers
Heat Indices Explained
A heat index indicates what the temperature actually feels like to the human body, 1 taking into account relative humidity or other factors such as air humidity, sun exposure and wind speed, depending on the index used. Tool tip A comparison and appraisal of a comprehensive range of human thermal climate indices
Heat Index / Humidex
Heat Index (and the related Humidex in Canada) is defined by a combination of temperature and humidity, to capture the effect of high humidity diminishing the body’s ability to cool itself through evaporation.
Wet-bulb Globe Temperature
Wet-bulb Globe Temperature (WBGT) is a composite temperature. It is used to estimate the effect of temperature, humidity, solar radiation and wind speed on the human body.
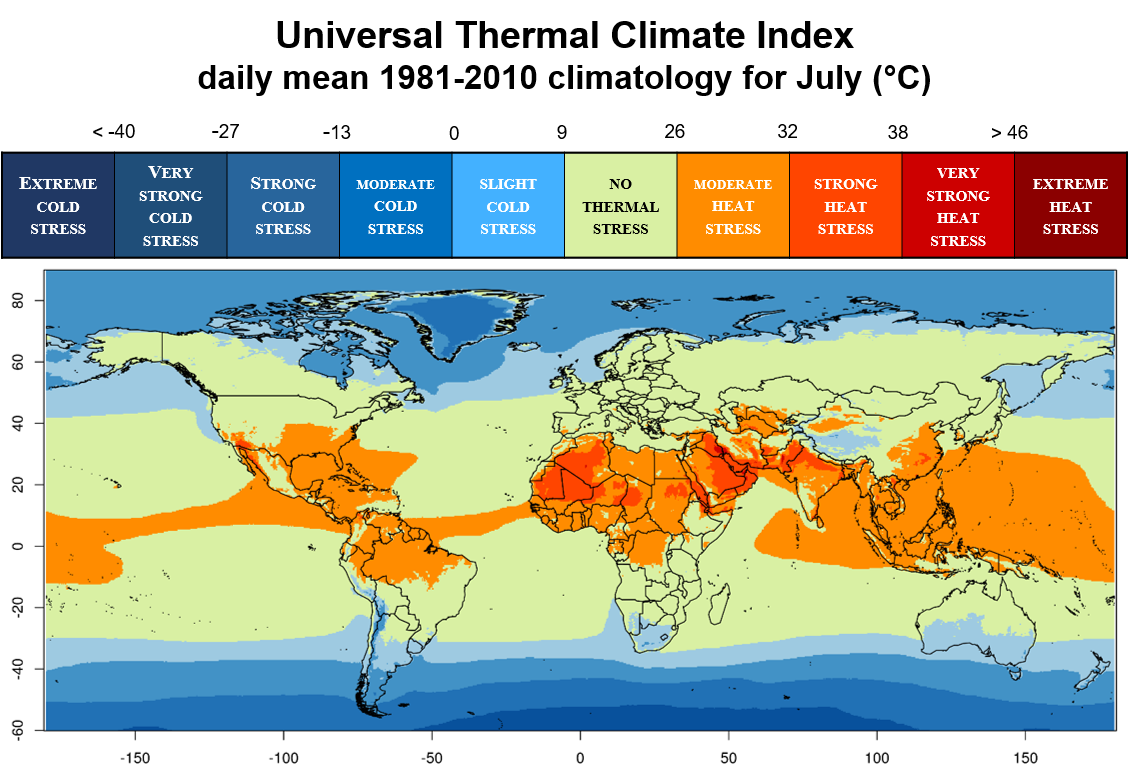
Universal Thermal Climate Index
Universal Thermal Climate Index (UTCI) and other thermal indices are more complex and based on the energy budget and exchange of the human body. In addition to temperature and humidity, they include radiation fluxes (solar and terrestrial) and wind speed, as well as thermo-physiological information (metabolism and clothing).
Measuring and Monitoring Heat
Historical and real-time measurements are needed to understand how extreme temperature events and the climate are changing, and to understand how high temperatures impact health. Meteorological agencies around the world track temperatures using various observing systems, and integrate these observations to provide climate products for analysis. In some cases, comprehensive datasets known as reanalyses are created by running climate models that can fill observational gaps with a best estimate of the likely value for a given point in space and time.
Predicting High Temperatures
Weather and climate models are used to predict future temperatures, and though related, have slightly different aims.
Weather models are used to produce deterministic forecasts – they predict the expected temperature at a given location and point in time. They are most accurate predicting out to about 10 – 14 days into the future. Weather forecasts can inform action when a heatwave is imminent.
Climate models are used to predict long-term changes in environmental conditions, and are used for predictions from decades to centuries and even millennia. Climate models can assist urban planning in preparation for future heat extremes.
In between climate and weather models, a relatively new but maturing area of prediction is on the seasonal and sub-seasonal timescale (S2S), forecasting weeks to months in advance. Models used for S2S predictions are often climate models, but they are in some respects run operationally more like a weather model. https://www.nap.edu/read/21873/ 2 These models fill the forecasting gap between weather and climate predictions. S2S models can inform early messaging and budgeting decisions in preparation for the heat season.
All of these model types can be used to predict extreme temperatures, and are useful as an integrated set of information for decision-making.
Most countries have a series of forecasts and alerts available at different timescales from months to hours. These may vary from country to country Tool tip See examples local definitions used in the United States and Canada but generally refer to:
Outlooks
Outlooks are typically issued as short reports and provide the most lead time of all product types. Outlooks are probabilistic, rather than deterministic, so they do not indicate that a heatwave will occur, but rather whether the season or month in question will be hotter than average. For example, a seasonal outlook might speak to the overall severity of the entire heat season, while a monthly outlook may predict whether July of the present year is likely to be above or below normal as compared to previous Julys on record.
Tool tip
Example: Caribbean Regional Climate Center experimental heat outlook
Watches
Watches indicate if conditions favour the formation of a severe weather event. They do not indicate that a heatwave is certain to occur, but that attention should be paid to future forecasts which may warn about the formation of extreme conditions.
Warnings
A warning indicates that an extreme condition is expected – that a heatwave is likely to occur within the next day or so (varies by country).
Example heat forecast systems:
Heat Health Warning Systems
Heat health warning systems (HHWS) are a critical part of identifying, preparing, and responding to heat risks.
Heat health warning systems are decision tools developed jointly by epidemiologists and meteorologists. All HHWS develop impact-based forecasts which establish when temperature and humidity conditions will locally produce heat at a level which is dangerous to human health and may result in heat illness and mortality.
Epidemiologically-derived temperature thresholds are used to trigger locally relevant alerts of heat danger and central to the systems operation. Locally tailored heat alerts or advisories serve to alert decision-makers and the general public to impending dangerous hot weather and what types of actions should be taken at each danger level to protect individuals from hot weather. The technical specifications and HHWS implementation approach are custom designed to reflect local conditions, and thus may vary significantly between cities, regions and countries.
Common components of all HHWS include:
- Weather forecasts of high temperatures that may also include humidity, and other factors;
- Locally relevant heat-stress thresholds for action;
- A method for assessing how future weather patterns may impact a range of heat-related health outcomes;
- A system of graded alerts/actions for communication to the public or specific target groups.
Effective communication and dissemination strategies are critical to the HHWS contributing to early action, lives saved or hospital admissions reduced. HHWSs should provide intelligence for a wider Heat Action Plan. Heat Action Plans or strategies may be stand alone or integrated with other multi-hazard or emergency preparedness efforts. These plans are generally coordinated by government in collaboration with a large number of civic partners. Heat Action Plans help clarify key actor roles, and ensure the coordinated delivery of public messages and advisory, heat-event preparedness actions, and evaluations.
Example Heat Health Warning Systems:
Heatwaves Explained
Understanding Heatwaves
Australia's Heatwaves Service runs from October until the end of March each year, providing critical heatwave assessments and forecasts for public health.
Heatwave Intensity Explained
WMO's heat expert John Nairn explains why it's important to measure heatwave intensity
A heatwave is a period of unusually hot weather (maximum, minimum and daily average temperature) over a region persisting at least two consecutive days during the warm period of the year based on local climatological conditions, with thermal conditions recorded above given thresholds. Source WMO Draft Guidelines on the Definition and Monitoring of Extreme Weather and Climate Events
Persistent, abnormally high temperatures can be caused by a variety of climate and weather phenomena, but the canonical driver of a heatwave is a strong and slow-moving high pressure system that remains in place over an area for a period of time. In some cases, these systems are held in place by an atmospheric blocking pattern, such as an omega block, which is a pair of low pressure zones that surround a high pressure zone and serve to lock it in place for an extended period of time. Source What exactly are heat domes and why are they so long-lasting and miserable?
Other drivers of heatwaves include longer-term climate patterns such as El Niño, weather extremes such as tropical storms, and climatic extremes such as droughts, which rob the soil of moisture and can cause heat events to be even more intense. Source Vautard, R., Yiou, P., D’Andrea, F., de Noblet, N., Viovy, N., Cassou, C., Fan, Y. (2007). Summertime European heat and drought waves induced by wintertime Mediterranean rainfall deficit. Geophysical Research Letters, 34(7). doi:10.1029/2006gl028001
In all world regions the characteristics of extreme temperatures are being observed to change in similar ways, including longer heat seasons, more frequent heat waves, and more intense heat days. Tool tip Changes in regional heatwave characteristics as function of increasing temperatures
Heatwaves are most frequently characterized by:
- Magnitude: The departure from normal, reflecting the climatological extremity of the event
- Duration: Measuring the duration of elevated temperatures
- Extent: The geographical extent of the heatwave
- Severity: Indicating potential damages and impacts of the event
- Timing of the event in the heat season
Other important heatwave measures include:
- onset date of the heat season
- minimum nighttime temperatures
- heat wave days
- heat wave number (annual number of heat wave events)
- heat wave frequency (annual frequency of days contributing to the heat wave events; the sum of participating heat wave days per year)
Urban Heat Islands
Cities are heating faster than anywhere else. Urban heat islands are dense, central areas of cities that are hot relative to the suburban and rural areas surrounding them. These hot zones are created by the urban heat island effect, which is the amplification of local temperatures due to several common characteristics, listed below.
Fortunately, knowing the causes enables action and management, and urban planners and other decision makers can work to address urban heat using interventions such as sun shades, increasing urban tree canopy, and painting rooftops white.
Lack of vegetation:
Vegetation provides shade, increases humidity and increases evaporation, lessening the heat felt by humans. Most cities and densely populated parts of cities have less vegetation than their surrounding areas, and thus lose out on these cooling effects.
Reflectivity (low albedo):
Cities tend to be constructed of darkly colored materials, such as blacktop on streets and tar on rooftops. These materials absorb more shortwave radiation from the sun, and emit it as longwave radiation. Lighter colors reflect more of the shortwave energy coming from the sun without absorbing it, thus keeping the surface cooler. Complex urban morphology leads to multiple reflexion and finally to lower albedo in urban structures.
Urban canyons:
Skyscrapers and other tall buildings form urban canyons. The taller the buildings, the lower the sky view factor (SVF), which means less of the sky is visible from the ground. Urban areas are cooled by releasing longwave radiation back to the atmosphere, but in an urban canyon with a low SVF, this cooling is curtailed because the buildings block the release of energy back to the atmosphere.
Heat storing materials:
Buildings and streets are constructed of materials that store heat and release it slowly, which is why the Urban Heat Island effect is stronger during evening and night, when buildings continue to release heat absorbed throughout the day even after the sun goes down.
Waste heat:
Air conditioning, vehicles, industrial and other systems that convert energy give off waste heat as a byproduct of their use. A high concentration of these systems in cities channel a large amount of waste heat into the urban environment, warming up the air temperatures that humans experience.
Key Resources
Report
World Meteorological Organization (WMO)
2019
Guidance
Guidance
World Health Organization (WHO), World Meteorological Organization (WMO)
2015
Guidance

World Meteorological Organization (WMO)
2015
Network Priorities
To learn more about network priorities related to heat forecasting, urban climate and early warning systems, please see our Pillars of Integrated Heat Action.
Page contributors: Hunter Jones, Andreas Matzarakis, Joy Shumake-Guillemot Banner image: NASA