

Results found: 48
of 4
Map
Early Warning System
Dashboard
New York State Heat Risk and Illness Dashboard
New York State Department of Health | 2025
Resource Hub
Map
Map
Resource Hub
Map
Data
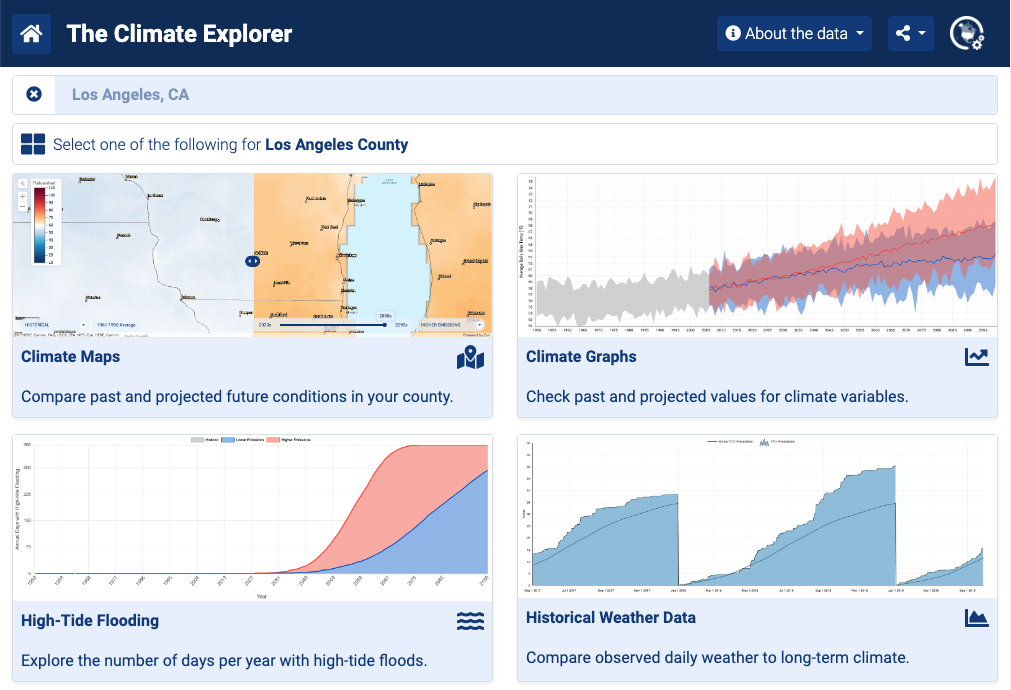
Tool
Resource Hub
Tool
Global Probabilistic Extremes Forecast Tool
National Oceanic and Atmospheric Administration (NOAA)
Data
UK Office for National Statistics, African Institute for Mathematical Sciences (AIMS) Rwanda, Regional Institute for Population Studies (RIPS) at the University of Ghana, UK Health Security Agency (UKHSA), Cochrane Planetary Health Thematic Group | 2025
Resource Hub
Social Media Toolkit
Centers for Disease Control and Prevention (CDC) | 2018
Toolkit
Harvard T.H.Chan School of Public Health C-CHANGE & amerizares | 2024
Resource Hub
The Medical Society Consortium on Climate & Health
The Medical Society Consortium on Climate and Health
Resource Hub

National Institutes of Health (NIH)
Resource Hub
Resource Hub
Weather Safety Materials for Individuals with Intellectual Disabilities
National Oceanic and Atmospheric Administration (NOAA)
Resource Hub
Resource Hub
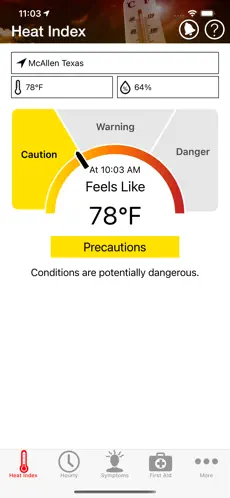
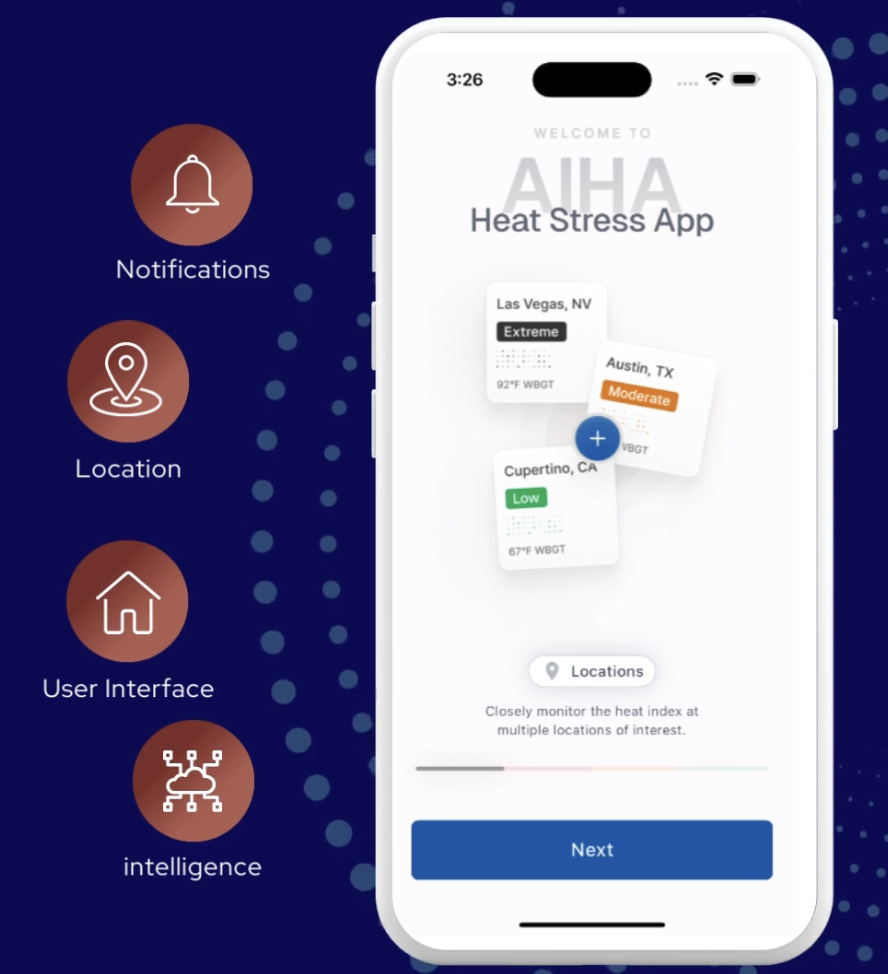
Mobile App
Resource Hub
Protecting Children from Extreme Heat - U.S
United States Environmental Protection Agency (EPA) | 2023
Resource Hub
Infants and Children and Heat - U.S
Centers for Disease Control and Prevention (CDC) | 2024
Website
Resource Hub
Resource Hub
Website
Website
Resource Hub
Tool
Checklist
World Health Organization (WHO) | 2019
Tool
European Centre for Medium-Range Weather Forecasts (ECMWF) | 2024
Resource Hub
Toolkit
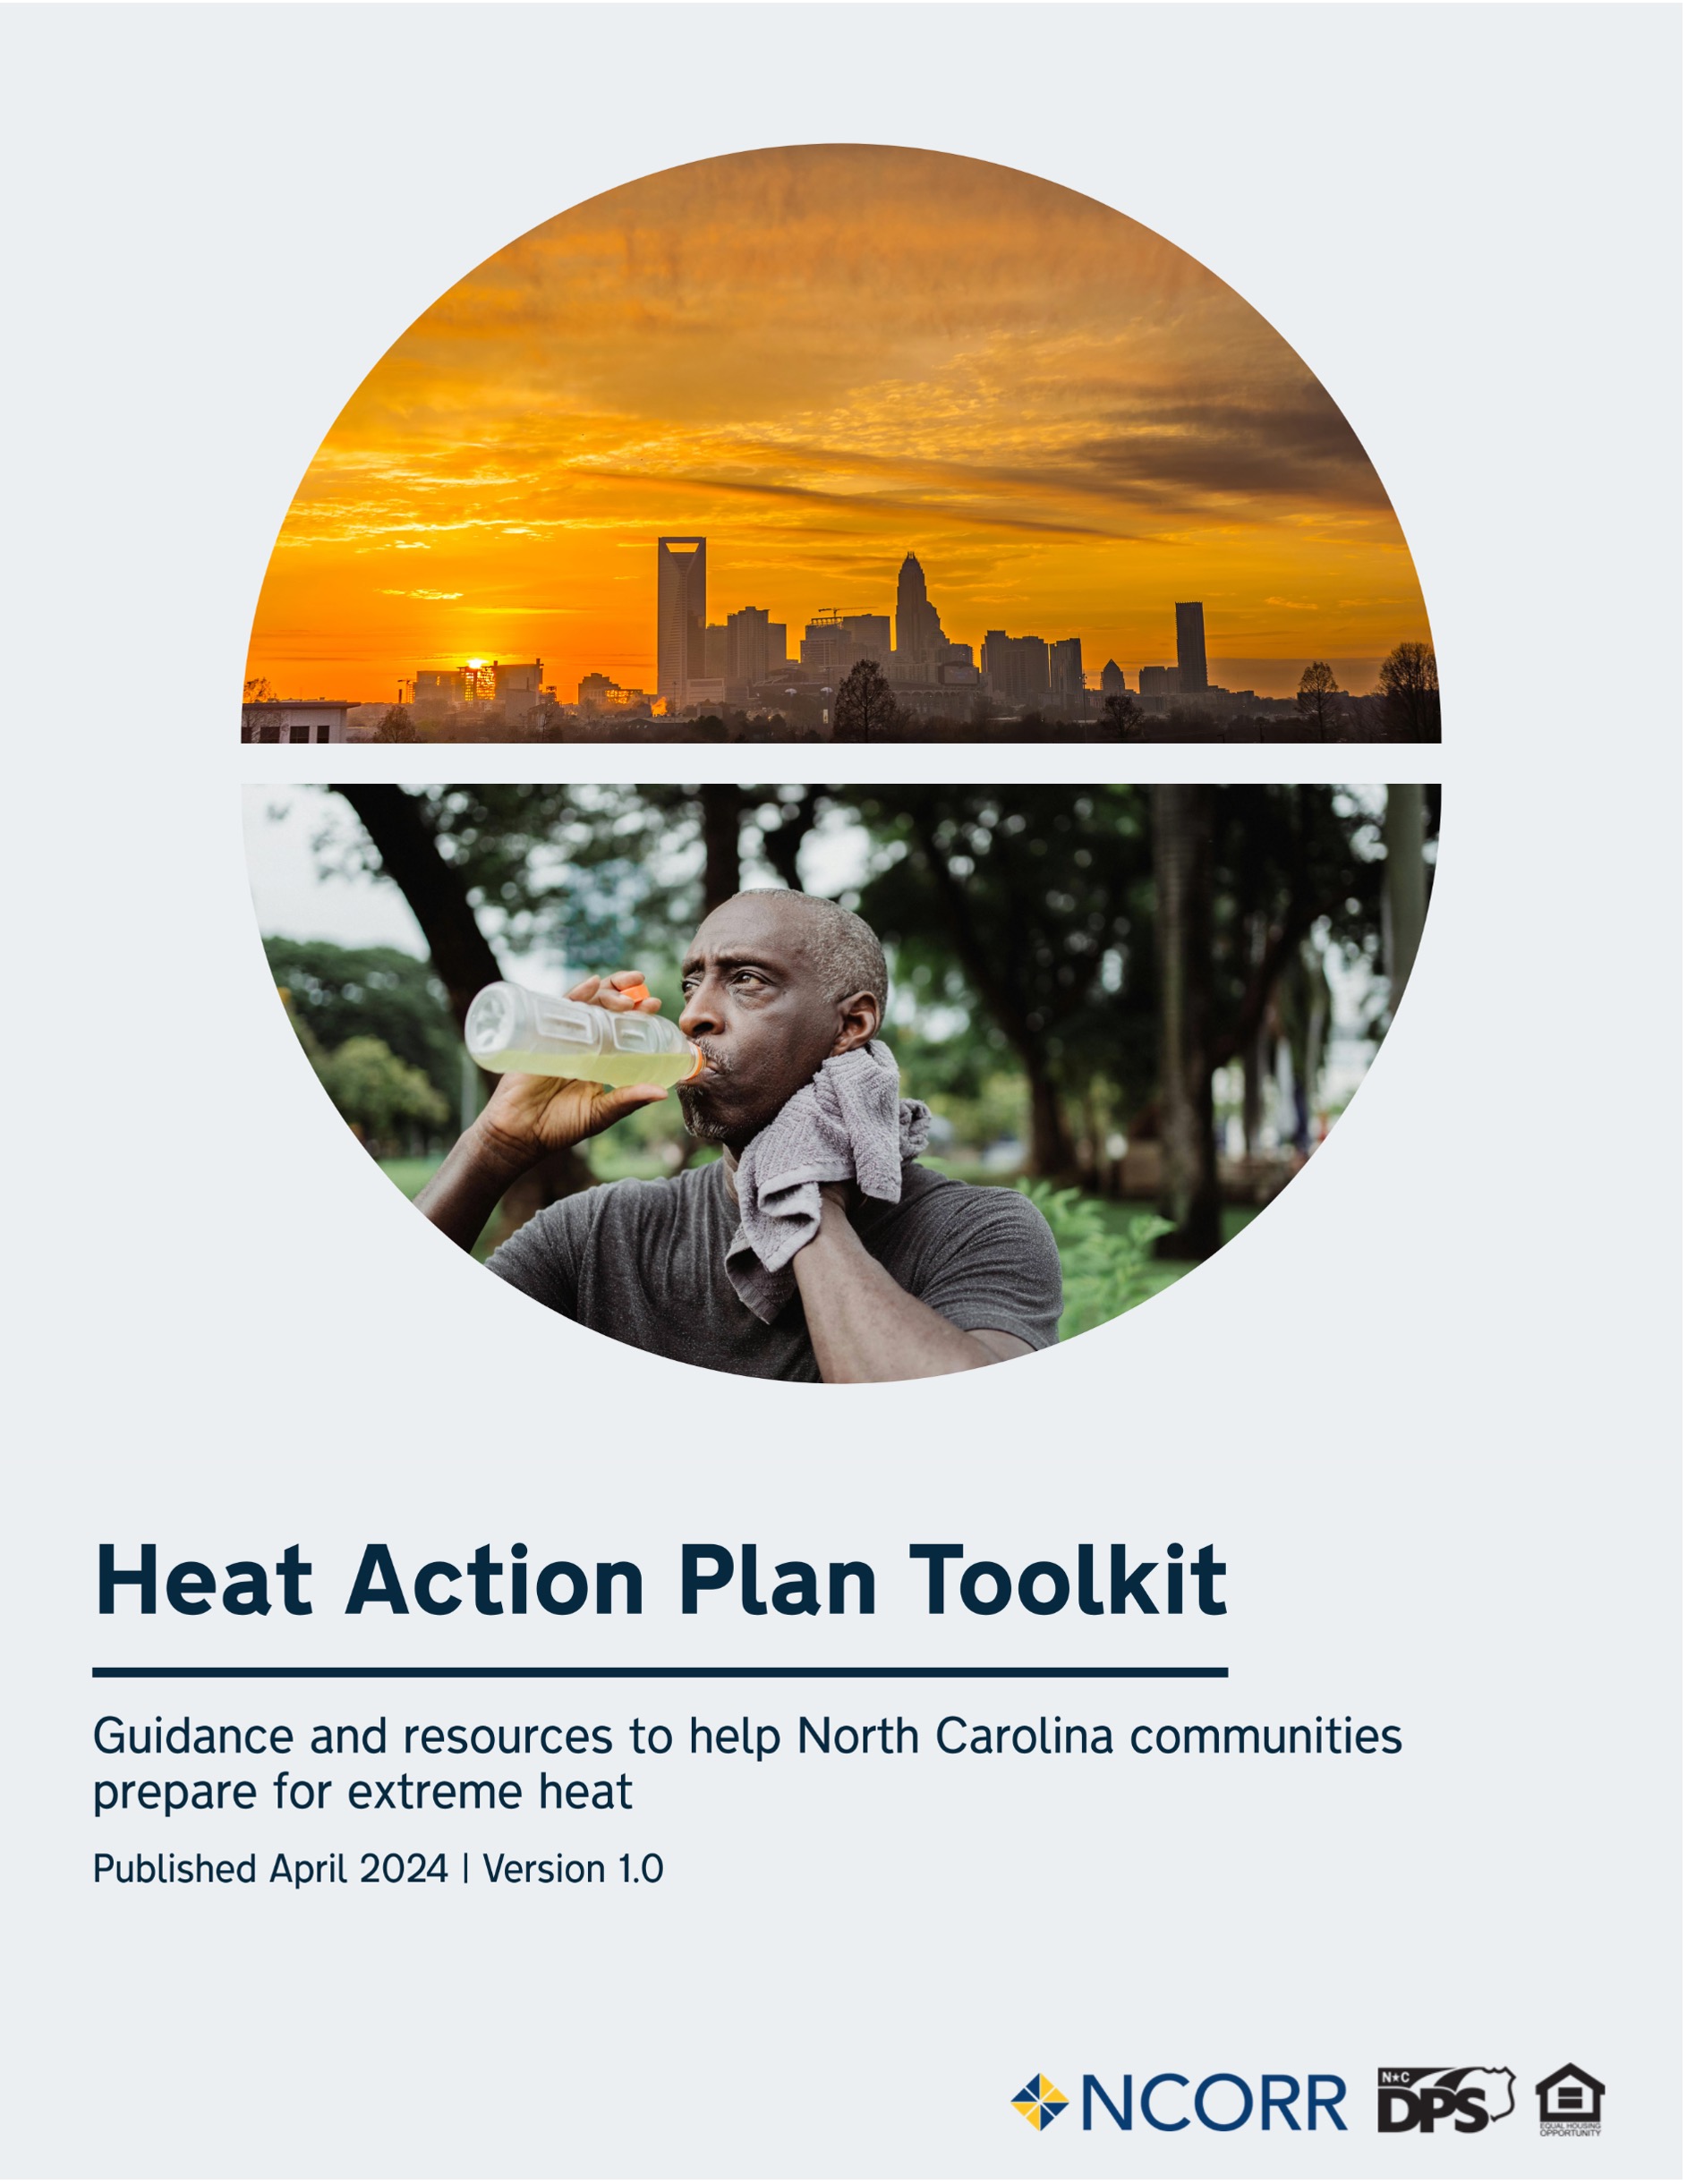
Carolinas Climate Adaptation Partnership, Carolinas Collaborative on Climate Health and Equity & North Carolina State University | 2024
Resource Hub
Resource Hub
Resource Hub
Tool
Resource Hub
Mobile App
Resource Hub
Resource Hub
Hot weather and health: supporting vulnerable people - England
UK Health Security Agency | 2024
Resource Portal
Resource Portal: Les gestes et astuces pour mieux vivre avec la chaleur
Santé publique France | 2024
Tool
Mobile App
Toolkit
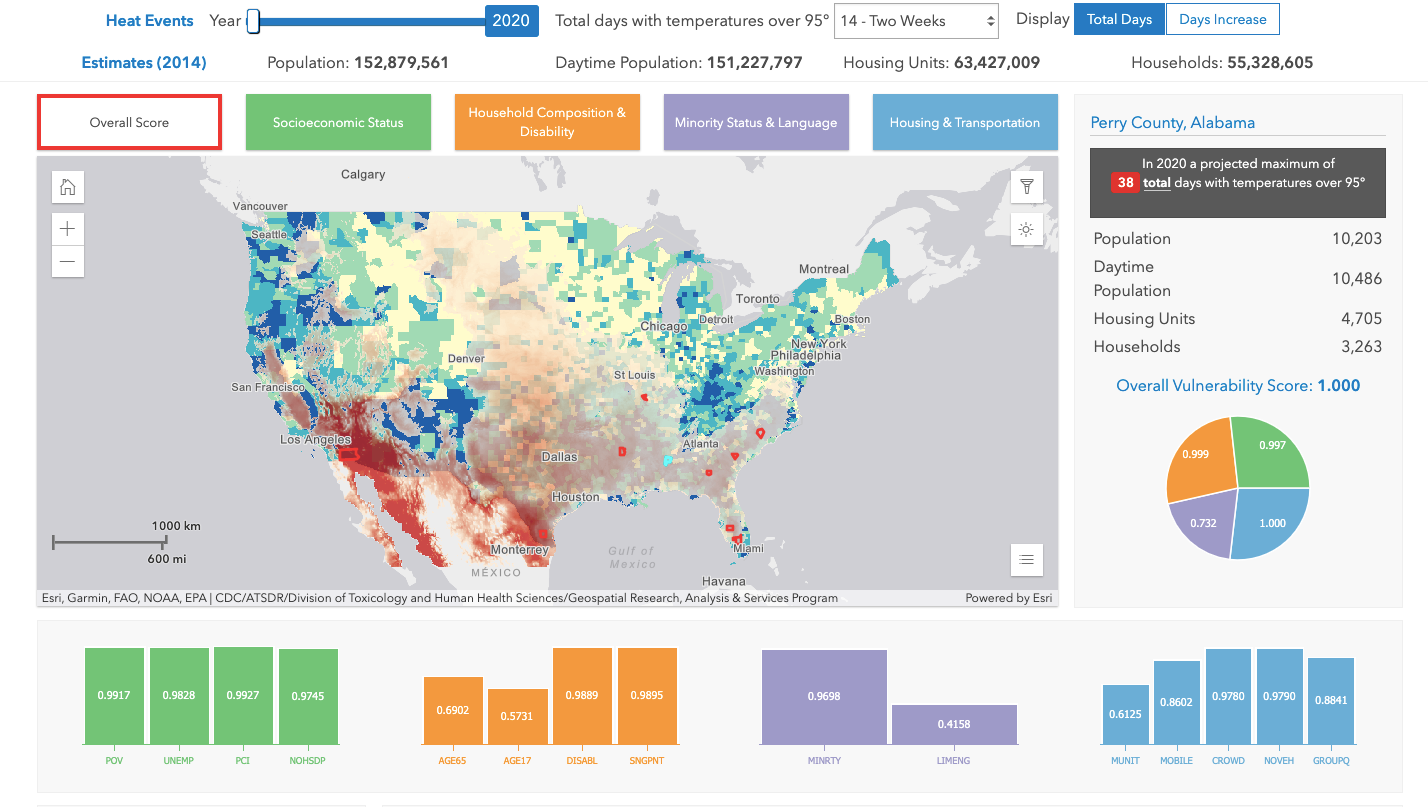
Risk Assessment Tool
U.S. Global Change Research Program (USGCRP), U.S. Federal Geographic Data Committee (FGDC), Department of the Interior (DOI), National Oceanic and Atmospheric Administration (NOAA) | 2022
Education Platform

Clinical Guidance
Heat Health for Healthcare Professionals
Centers for Disease Control and Prevention | 2024
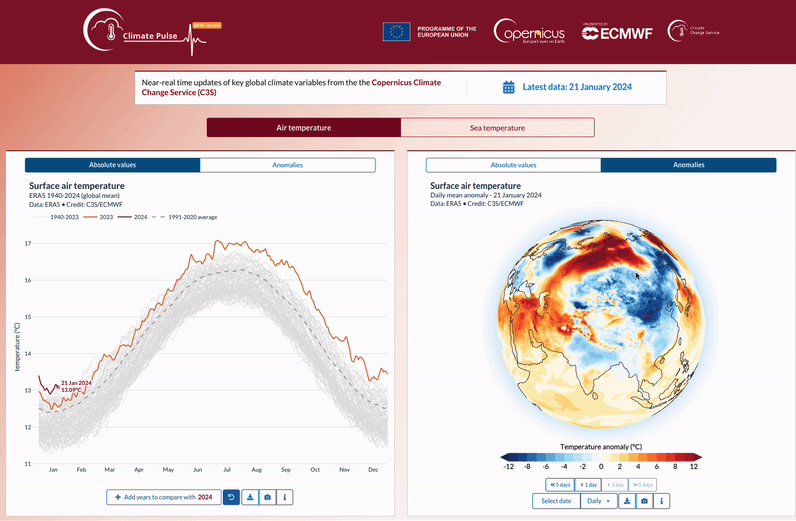
Dashboard
Forecast Tool
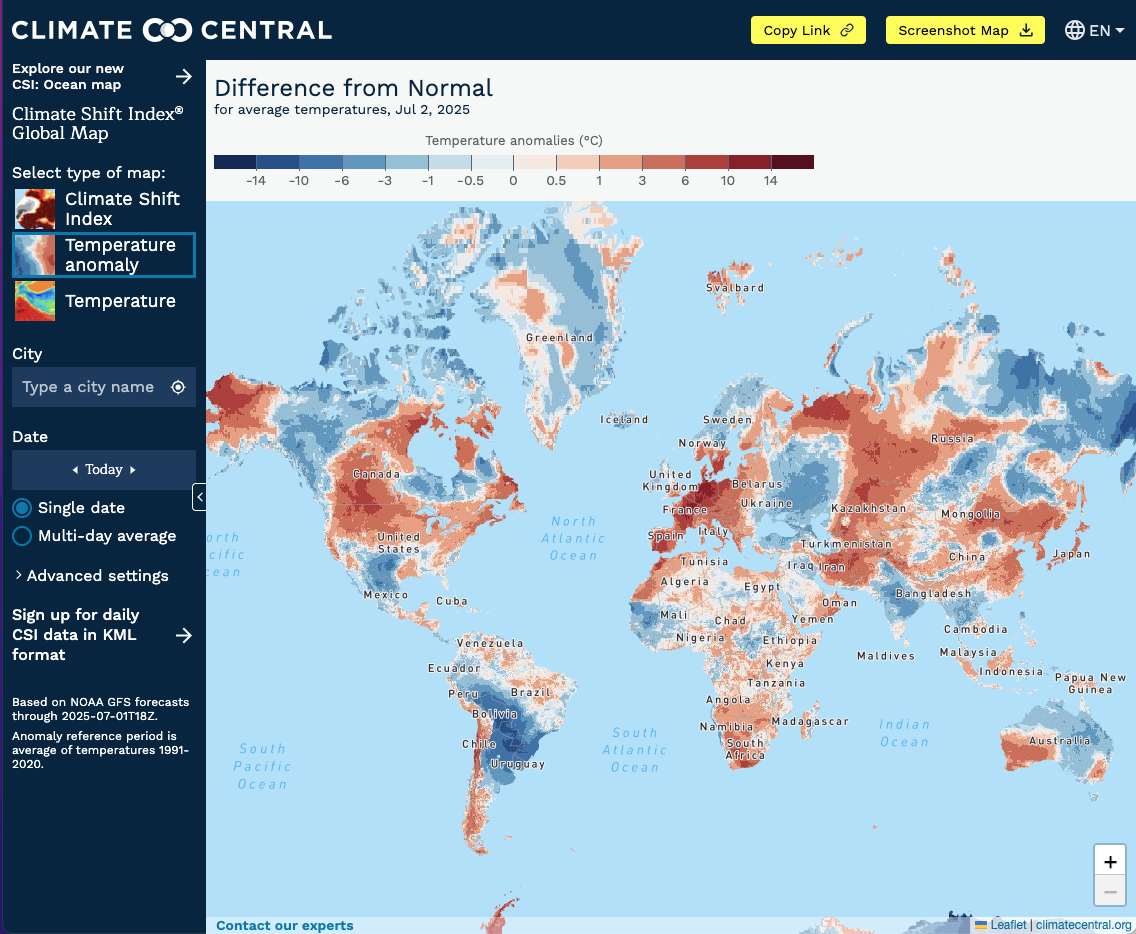
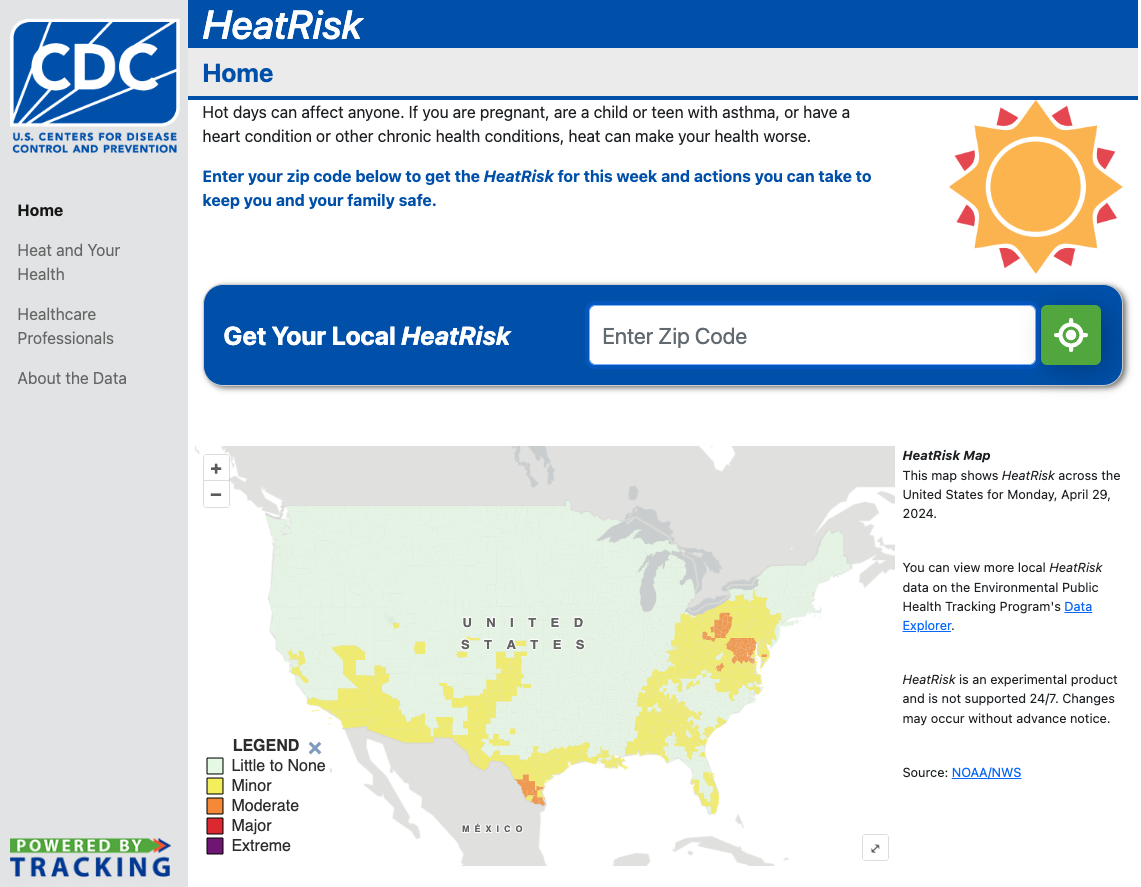
Interactive Map
Copernicus Climate Change Service (C3S) & World Meteorological Organization (WMO) | 2024
Dashboard
Research Hub

London School of Hygiene & Tropical Medicine (LSHTM) | 2024
Research Hub

Tool
Interactive Web
Interactive Atlas
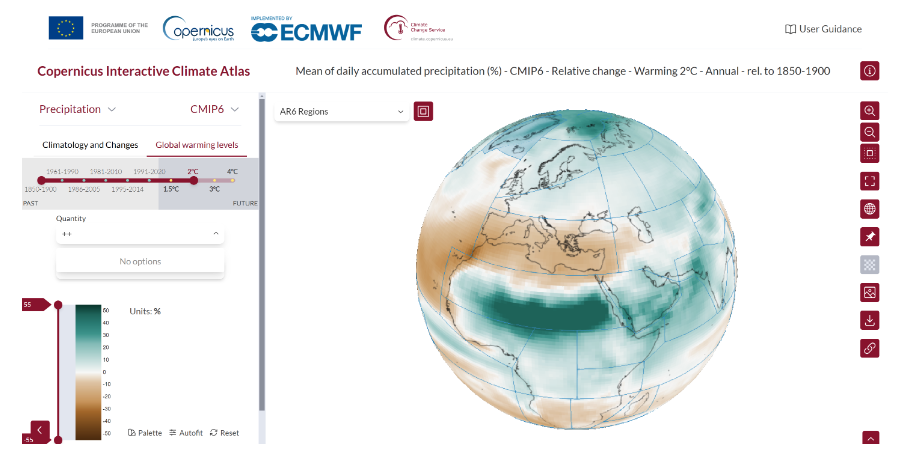
Tool
Imagery Layer
Evening air temperature for U.S. cities for use in urban heat island (UHI) mapping
NOAA/CAPA Strategies | 2023
Tutorial
Tool
Tool
Teaching tools
Tool
Eco-Health Relationship Browser
United States Environmental Protection Agency (EPA) | 2023
Tool
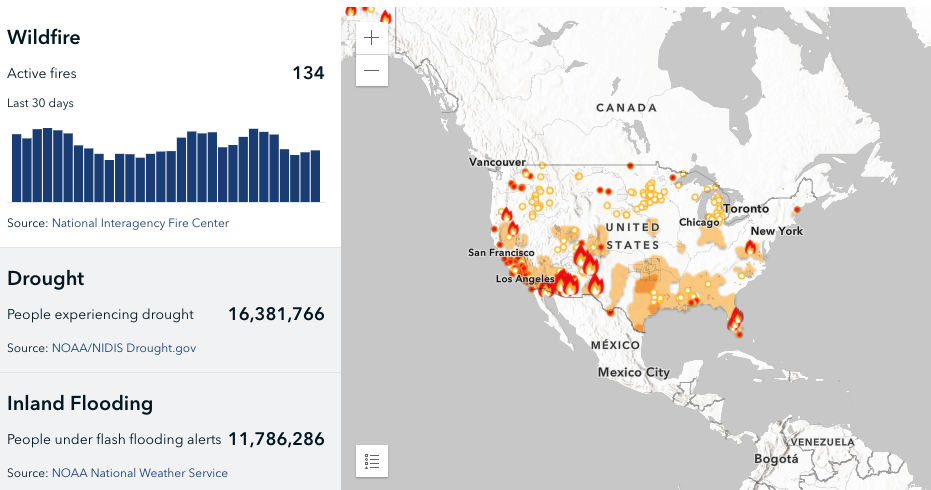
Map
Dataset
Tree Cover Map
Data Set
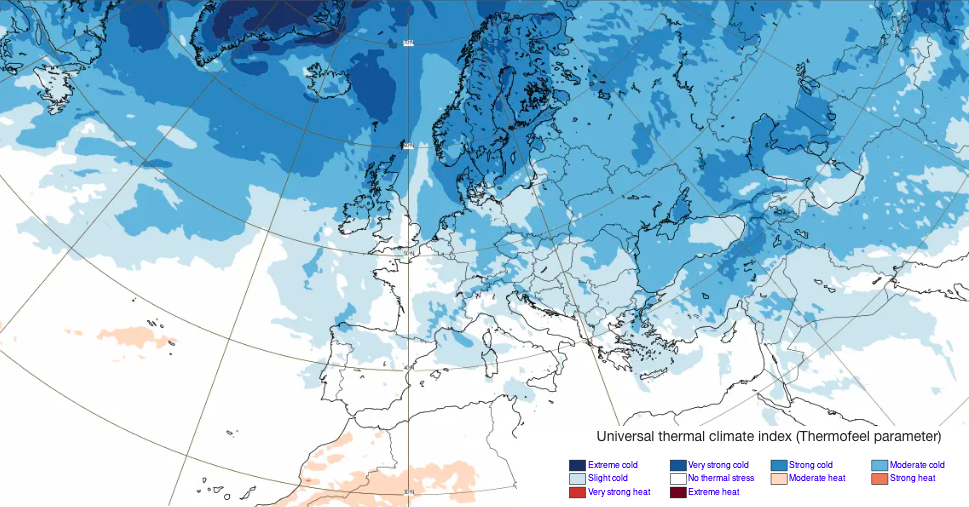
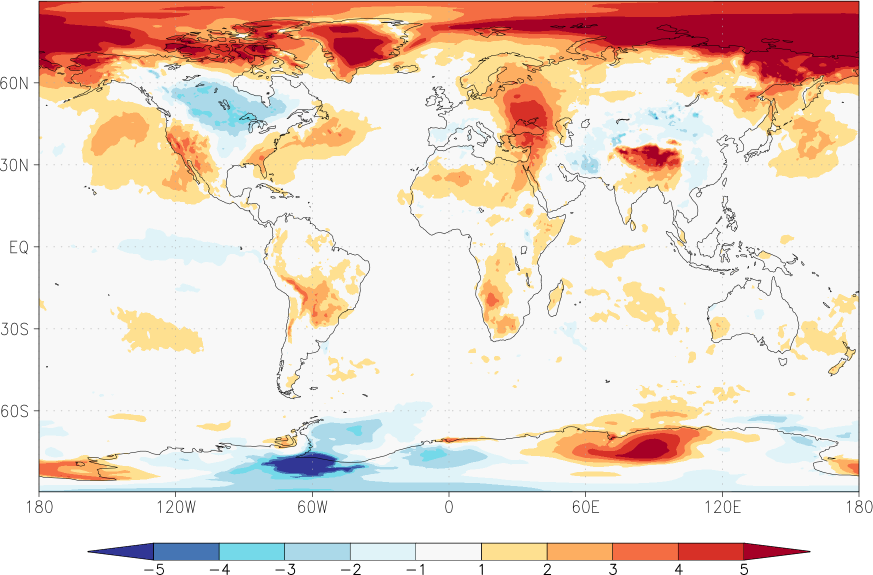
Thermal comfort indices derived from ERA5 reanalysis
European Centre for Medium-range Weather Forecasts | 2020
Checklist
Resource hub
National Collaborating Centre for Environmental Health | 2023
Tool
Heat Stress & Exercise Risk Tool
Heat and Health Research Incubator, University of Sydney | 2023
Guide
Health checks during extreme heat events: A guide for doing in-person or remote health checks
National Collaborating Centre for Environmental Health | 2022
Toolkit and Guidance
Data and Resource Hub
Resource hub
Tool
Resource hub
Tool
European Climate and Health Observatory
Mobile App
Warning System
KMA Impact-based Heat Health Warning System (South Korea)
Republic of Korea National Institute of Meteorological Sciences | 2020
Database
Dataset
Multi-country survey of heat-health during COVID-19
ESRC/GCRF project "Cool Infrastructures" | 2020
Tool
Maps
Dataset
Data Tool
Mobile App (IT)
Ministero della Salute e dal Dipartimento di epidemiologia del servizio sanitario della Regione Lazio - ASL Roma 1
Warning System
Harmonized Heat Warning and Information System for Ontario (HWIS)
Environment and Climate Change Canada; Health Canada; Ontario Ministry of Health and Long-Term Care; Public Health Ontario
Dataset
Outlooks
Tool
Tools and Resources
Tool
Database / Tools
Dataset
Warning System (ES)
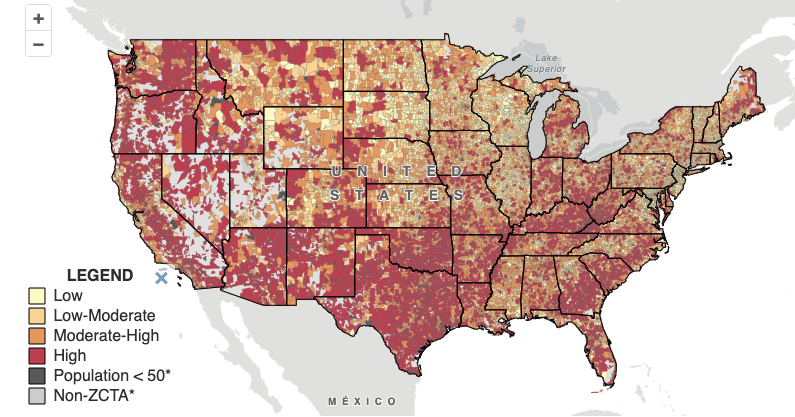
Interactive Map
The Future of Extreme Heat by Congressional District
Union of Concerned Scientists | 2019
Intervention Benefits Calculator
Database
Warning System
Warning System
Warning System
Warning System
Risk Map
Forecasts
Warning System
Warning System
Mobile App
Knowledge Base
Assessment Tool
California Heat Assessment Tool (CHAT)
Four Twenty Seven, California Natural Resources Agency
Mobile App
Knowledge Base
Climate-ADAPT: sharing adaptation information across Europe (EC and EEA):
European Commission, European Environment Agency
Decision-tools
Data Explorer
Data Explorer
European Environment Agency (EEA)
of 4